In this article I will provide a workflow for monitoring code coverage in DLLs called from a WCF Service hosted with IIS.
You can use this approach to get runtime code coverage metrics from any service, and also for calls made via reflection.
Supported processor architectures are x86, x64 and x64 running as x86 mode.
These two tools are installed with Visual Studio 2013 (later: VS)
Found under:
c:\Program Files (x86)\Microsoft Visual Studio 12.0\Team Tools\Performance Tools\
for 32-bit, native or 64-bit emulated, and in:
c:\Program Files (x86)\Microsoft Visual Studio 12.0\Team Tools\Performance Tools\x64\
for native 64-bit support.
Also available without VS (if you need to calculate code coverage on a remote server):
Here is the workflow:
Instrument any DLLs you want code coverage for, using this command:
vsinstr.exe /coverage "Library.dll"Stop IIS. For example, with Powershell:
1Stop-Service W3SVC;If you don’t stop IIS before running VSPerfCmd, everything will run, but the resulting code coverage file will be empty when you open it in Visual Studio.
Run VS profiler with “code coverage” option
VSPerfCmd.exe /start:coverage /output:"FOLDER\Output.coverage" /cs /user:"NT AUTHORITY\SYSTEM"``
/outputcan be any folder and file. Make sure you always specify an output file. If you forget, you will get:Error VSP1303: Unknown switch AUTHORITY\SYSTEM. Aborting.``
which has nothing to do with the cause of actual problem.
BTW, “NT AUTHORITY\SYSTEM” is the IIS service user, not the application pool user. Your configuration may vary - adjust accordingly.Start IIS. For example, with Powershell:
1Start-Service W3SVC;``
Check monitoring status:
VSPerfCmd.exe /status:``
If it started successfully, you will get some statistics:Process and Thread Status ============================================================ Output File Name : PATH_TO_FILE Collection mode : COVERAGE Maximum Processes : 64 Maximum Threads : 512 Number of Buffers : 514 Size of Buffers : 65536 ============================================================ Maximum Number of Processes : 64 Number of Active Processes : 0 Global Start/Stop Count : 1 Global Suspend/Resume Count : 0 ============================================================``
Otherwise you will get an error:Error VSP1306: Profile Monitor does not appear to be running.``
Run tests. When done, stop monitoring:
VSPerfCmd.exe /shutdown``
VSPerfCmd should now be waiting for IIS process to exit. Shut down the IIS service.
Almost done. The code coverage file should now be where you output it. You can open it in VS by double-clicking on the file. It’s best to put instrumented DLLs in the output folder. Otherwise it may or may not work.
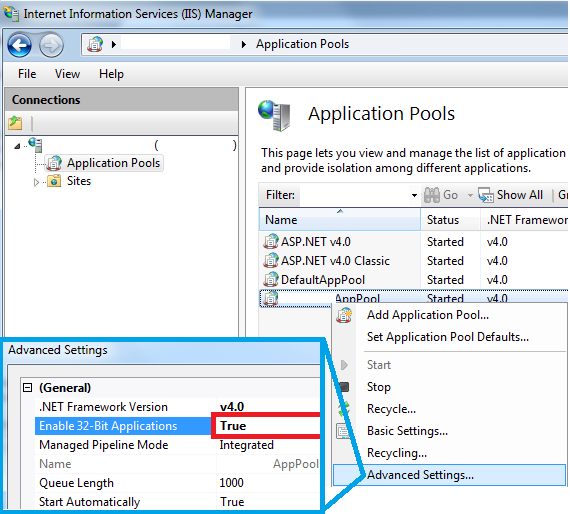
If you want to use 32-bit tools on a 64-bit OS, switch your application pool to 32-bit (x64/AnyCPU running as x86).
Here is how you do it, right-click on an application pool -> Advanced Settings… -> Enable 32-Bit Applications, set to True (default is False).
If you prefer visual instructions like me, see below screenshot:
Comments
One of my blog readers, Michael, found this post very helpful. Here are some useful observations that he shared with me over email:
1) My app could only work with instrumented code if it was running at "Full" trust level. Not sure if there is a way around that other than changing the trust level. 2) I had to specify the AppPool user not the IIS service user. Not sure if this is a Classic vs. Integrated pipeline thing or something else.